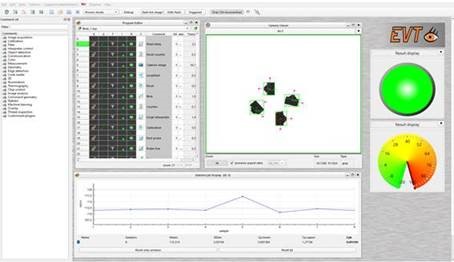
With the new EyeVision version 4.3, a completely revised GUI Designer has been added to the software, which allows not only meaningful statistics but also a variety of displays to be put together graphically. This means that measured values are not only visible as numerical values, but can also be presented in a meaningful way for the user. This is done, for example, in the form of a traffic light symbol, which shows a good or bad result in the classic traffic light colors. Any graphics can also be output, for example a smiley when the desired result is achieved.
A look at the pointer instrument gives a direct overview of the current values and whether they are still within the acceptable range or not. The production results can be easily and quickly surveyed.
A large number of other graphics complement the simple programming via drag and drop to create a graphical user experience.
All collected data can be distributed and statistically evaluated using internal protocols such as OPC UA, MQTT, Profinet.